


Obesity Statistics & Diets For Weight Loss Facts In US 2024
Health statistics on adult obesity rate, U.S. population perceptions of weight, and population perception of healthy choices in 2023.
Summary
Obesity rate in America is a hot topic of conversation; it’s a problem that is not only associated with having excess weight but also with its effects on the body.
It burdens the healthcare systems with increased severe illnesses, increasing medical costs for the population.
Both children and adults suffer from the increasing obesity epidemic, and it’s not just about eating too much and not moving enough; many other factors contribute to excess weight in adults, children, and adolescents.
People who struggle with obesity are confronted with factors they may or may not be able to control.
Methodology
Statista, a leading provider of market and consumer data, conducted the obesity and diet for weight loss facts statistics. One of Statista’s methods to obtain this data is by using an online questionnaire conducted in 55 countries with up to 60,000 respondents.
The target age range is internet users between 18-64 years of age and is an online survey that can take up to 20 minutes. Depending on the country, it’s available in the official language of that country and English.
Average American Weight
Americans and their average weight can’t be lumped into one group, especially because some groups are more prevalent and have higher obesity rates.
According to the Centers for Disease Control and Prevention, the prevalence of childhood obesity in America is still high; the majority was at 19.7%[1], affecting 14.7 million children and adolescents.
In adults, the numbers are not so great[2] either. The prevalence of obesity was 41.9% between 2017 and 2020.
The average American weight is affected by factors like
- Eating behaviors and other lifestyle habits.
- Genetics and underlying diseases.
- Ethnicity.
But also environmental factors like
- Stressors.
- Income levels.
- Effects of medications.
- Socioeconomic status.
- Accessibility to a safe space to be physically active.
To figure out if a person has a healthy weight or is overweight or obese, health professionals have several tools. The most prominent is the body mass index, BMI. It’s a formula[3] in which the person’s weight in kilograms is divided by the square of height in meters. There are also online body mass index calculators that can help determine what range a person falls under.
As you calculate a person’s weight with their height, a number will emerge; this number is used to determine at what range that person is; for example, anyone with a number 30 is already in the obese range. This number is plotted on an obesity chart and tracked over time; this is especially used in children to track growth.
Body Mass Index:
- Less than 18-underweight range.
- 18 to < 25 healthy.
- 25 to < 30 overweight range.
- 30 or higher obesity range.
Obesity is subdivided into groups
- Class I 30 to < 35.
- Class II 35 to < 40.
- Class III 40 or higher, known as severe obesity.
This, of course, is not a tool used to diagnose people’s body fat or health. The body mass index tool intends to state if the weight is appropriate for that person’s height.
Other factors not considered when measuring BMI are:
- Ethnicity.
- Gender.
- Muscle tone.
- Physical activity.
Therefore, it should not be the only tool to determine someone’s health.
Other tools used by health care professionals are the prevalence of obesity in ethnicity, a food recall, the amount of physical activity, and the presence or absence of chronic diseases.
For example, the ethnic group[4] with the highest age-adjusted prevalence for obesity at 49.9% are non-Hispanic black adults.
That means that a non-Hispanic black adult is also more likely out of all ethnic groups to experience:
- Weight gain much faster.
- An increased risk of chronic diseases like diabetes.
- Develop cardiovascular disease or heart disease.
This information tells us that non-Hispanic black adults may require additional support from a dietitian or physician to control weight gain and manage eating habits to help control the onset of chronic illnesses that are closely related to obesity. Other groups aren’t too far behind.
- Hispanic adults follow at 45.6%, with similar possibilities of developing chronic disease to non-Hispanic black adults.
- Non-Hispanic white adults at 41.4%, and lastly, a significant drop in non-Hispanic Asian adults at 16.1%.
- Age groups can also vary in the prevalence of obesity; between the ages of 20-39 years, the prevalence is at 39.8%; between 40-59 years old at 44.3%, and people older than 60 years old at 41.5%.
The age group highest in prevalence of obesity, between 40-59 years old, can be related to changes in the body due to age. There is a loss of fat-free mass muscle[5] and increased body fat percentage. It is evident that men lose more fat-free mass than women, but in the end, both increase in body fat percentage. A result that can lead to increased risks of developing chronic illnesses.
The Overview Of US People’s Weight Statistics
The following three graphs show how people and their weight perception vary.
- Where they see themselves as U.S. adults weighing just right, overweight, or underweight.
- What their average weight is by gender.
- How college students perceive themselves.
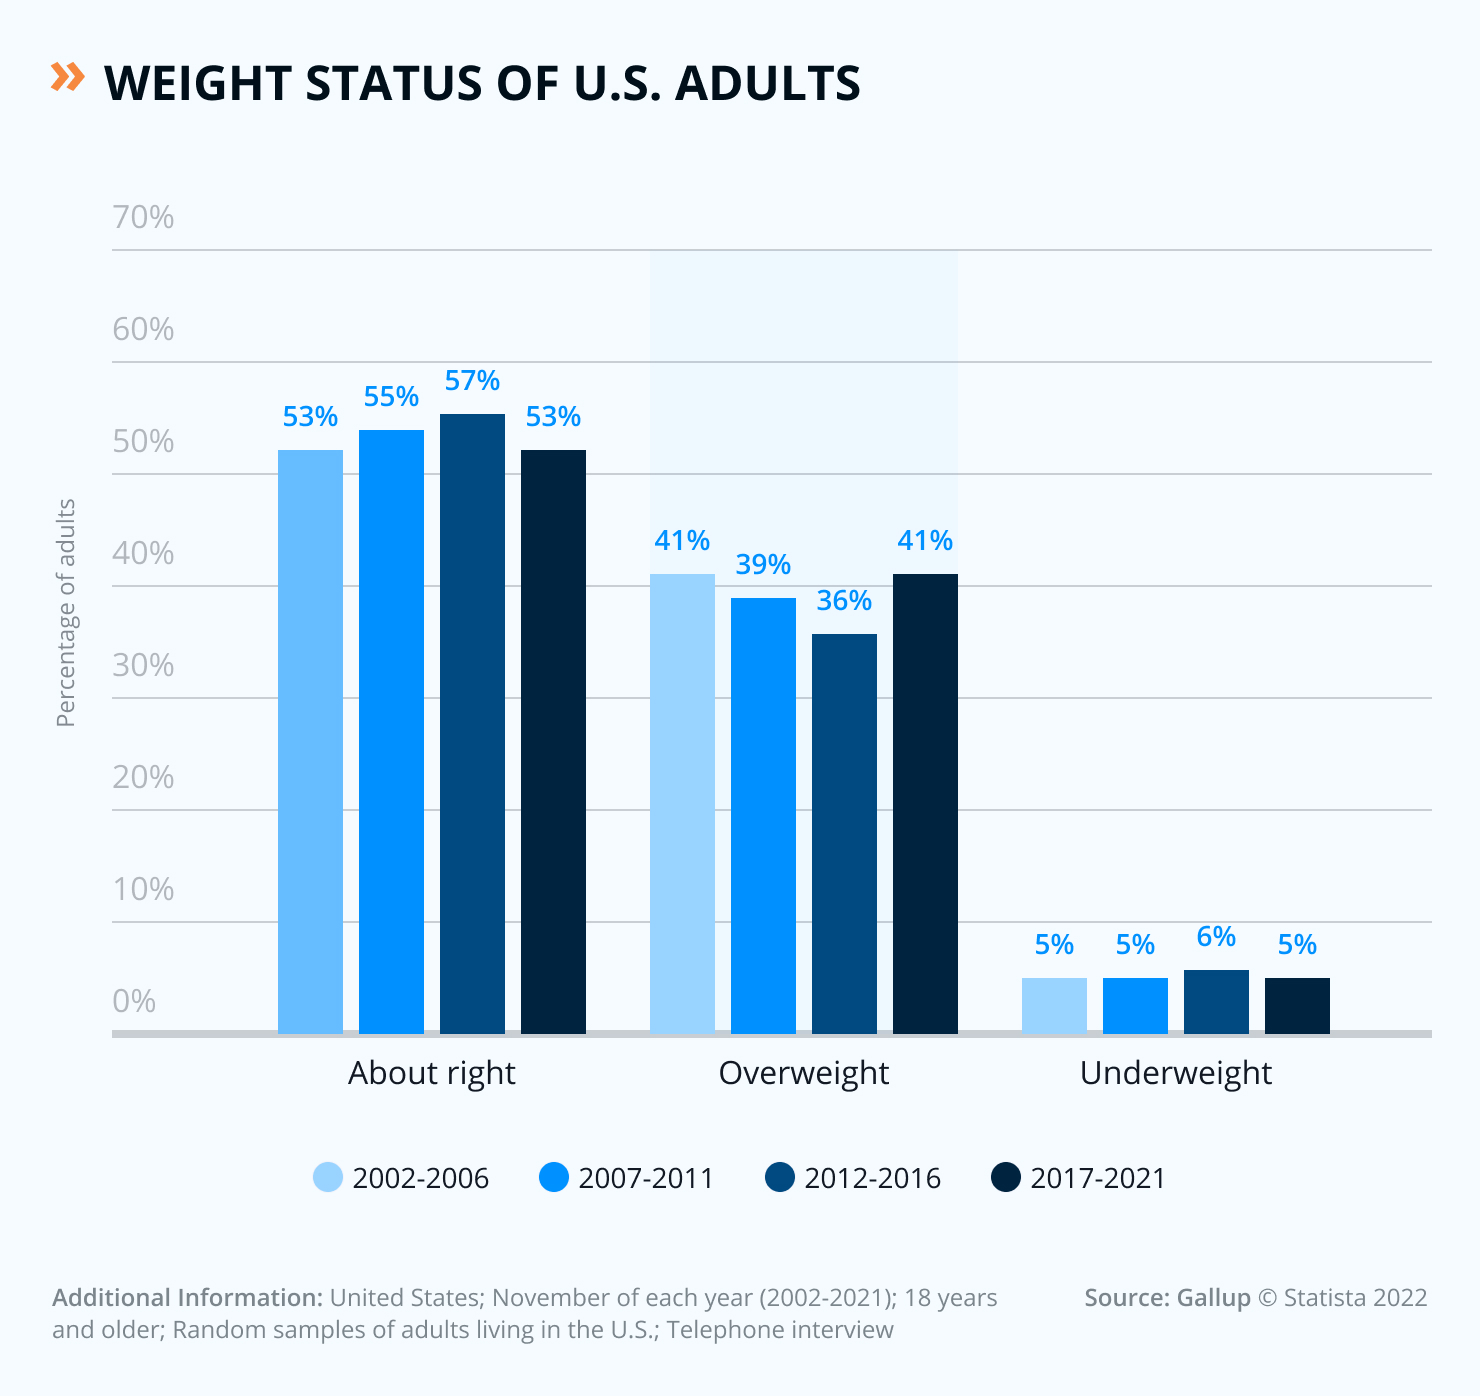
According to the survey[6], the percentage of U.S. adults who describe their weight as right, overweight, or underweight has varied very little.
For example:
- From 2002 to 2021, people who thought they were just about right were over 53%
- From 2002 to 2006, perception increased slightly
- From 2007 to 2016, from 55% to 57%, and back down to 53% from 2017-2021.
- People who perceived themselves as overweight between 2007-2006 were 41%, and between 2007-2016 it dropped from 39% to 36%. But between 2017 and 2021, it was back up at 41%.
- The last change in weight perception was that people who perceived themselves as underweight stayed at 5% except for the 2012-2016 range, which jumped to 6% but went back down to 5% from 2017-2021.
People’s perceptions of themselves tell us that over 50% feel they are just about right. This perception can affect a person if, in reality, their weight is well above where it should be and can deter a person from making the necessary changes to improve overall health.
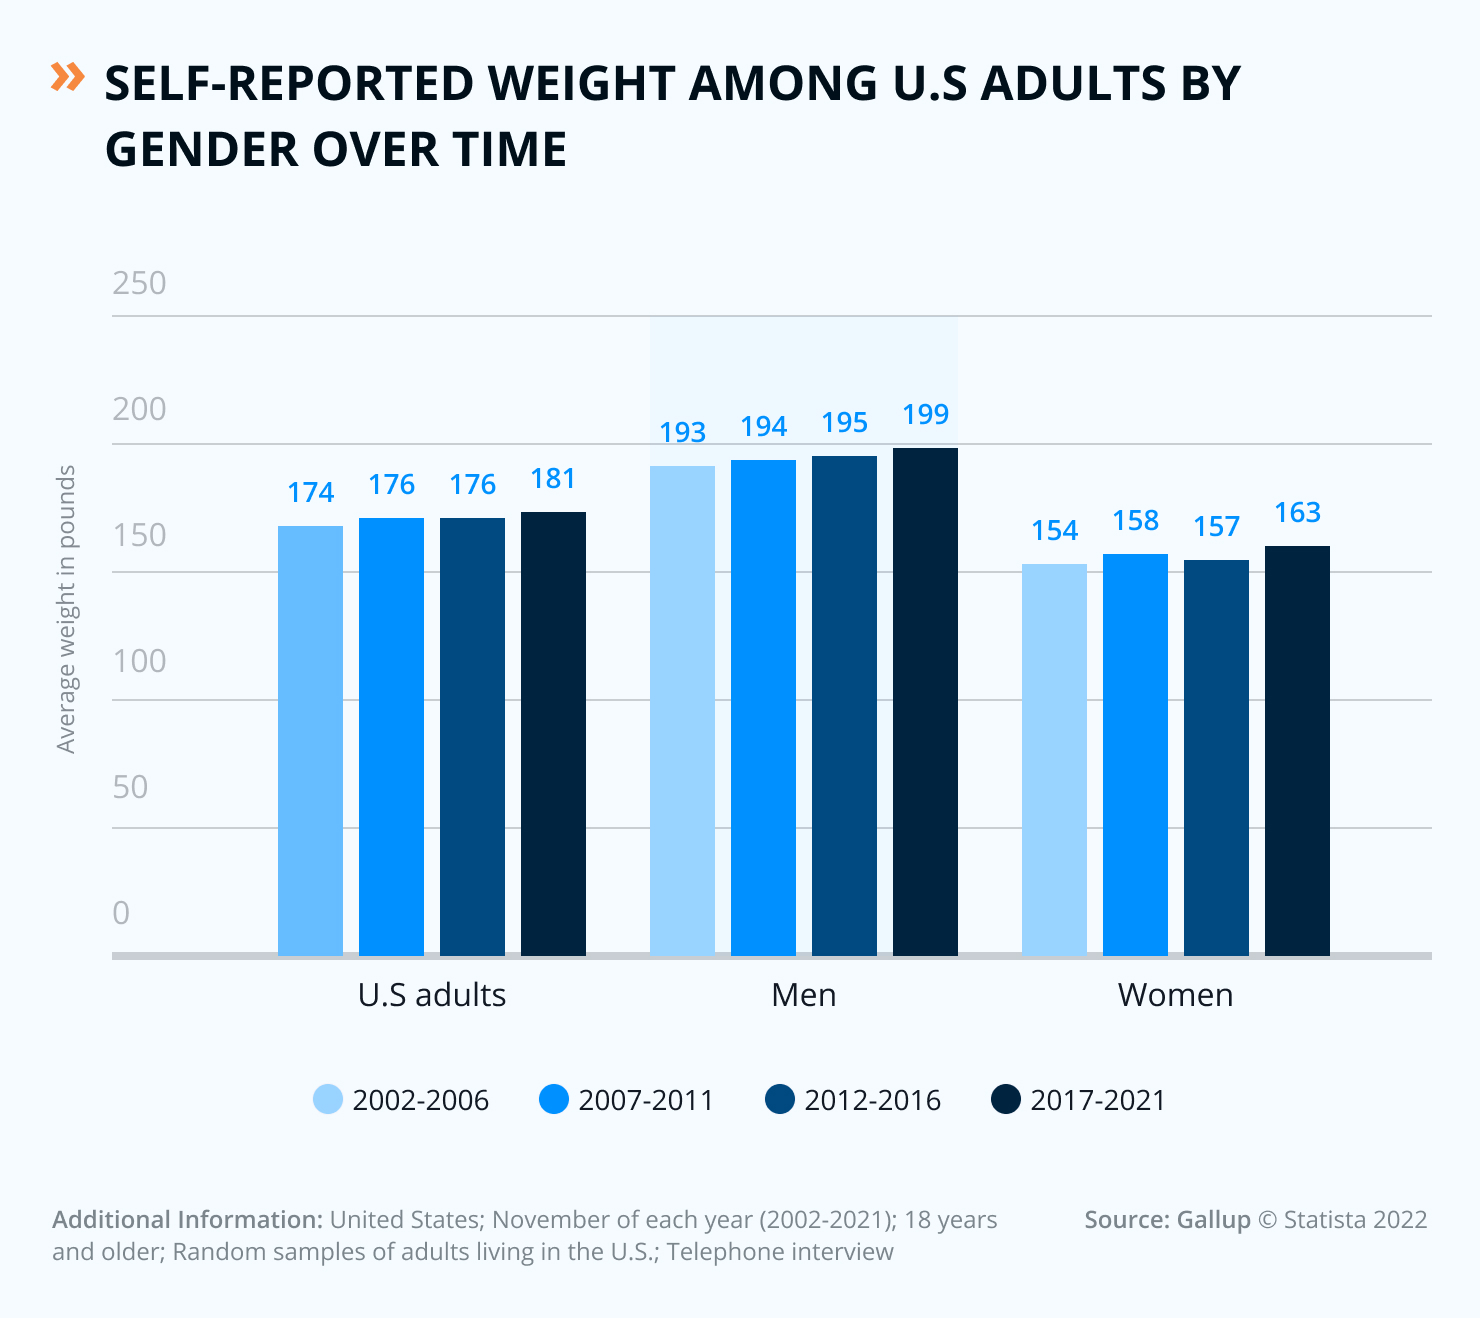
When gender is considered in the survey[7] shows self-reported weight among U.S adults over time:
- The average self-reported weight among U.S. adults from 2002 to 2021 has increased by seven pounds from 174 pounds in 2002 to 181 pounds in 2021.
- In men, the average weight increased by six pounds from 193 pounds in 2002 to 199 pounds in 2021.
- Women, however, increased by nine pounds from 154 pounds in 2002 to 163 pounds in 2021.
In 19 years, women have gained more weight than men, a trend that places women at a much higher risk of getting sick. But men have also gained weight and are also at increased risk of illness. In both genders, the average reported weight means the population is trending upward in weight status.
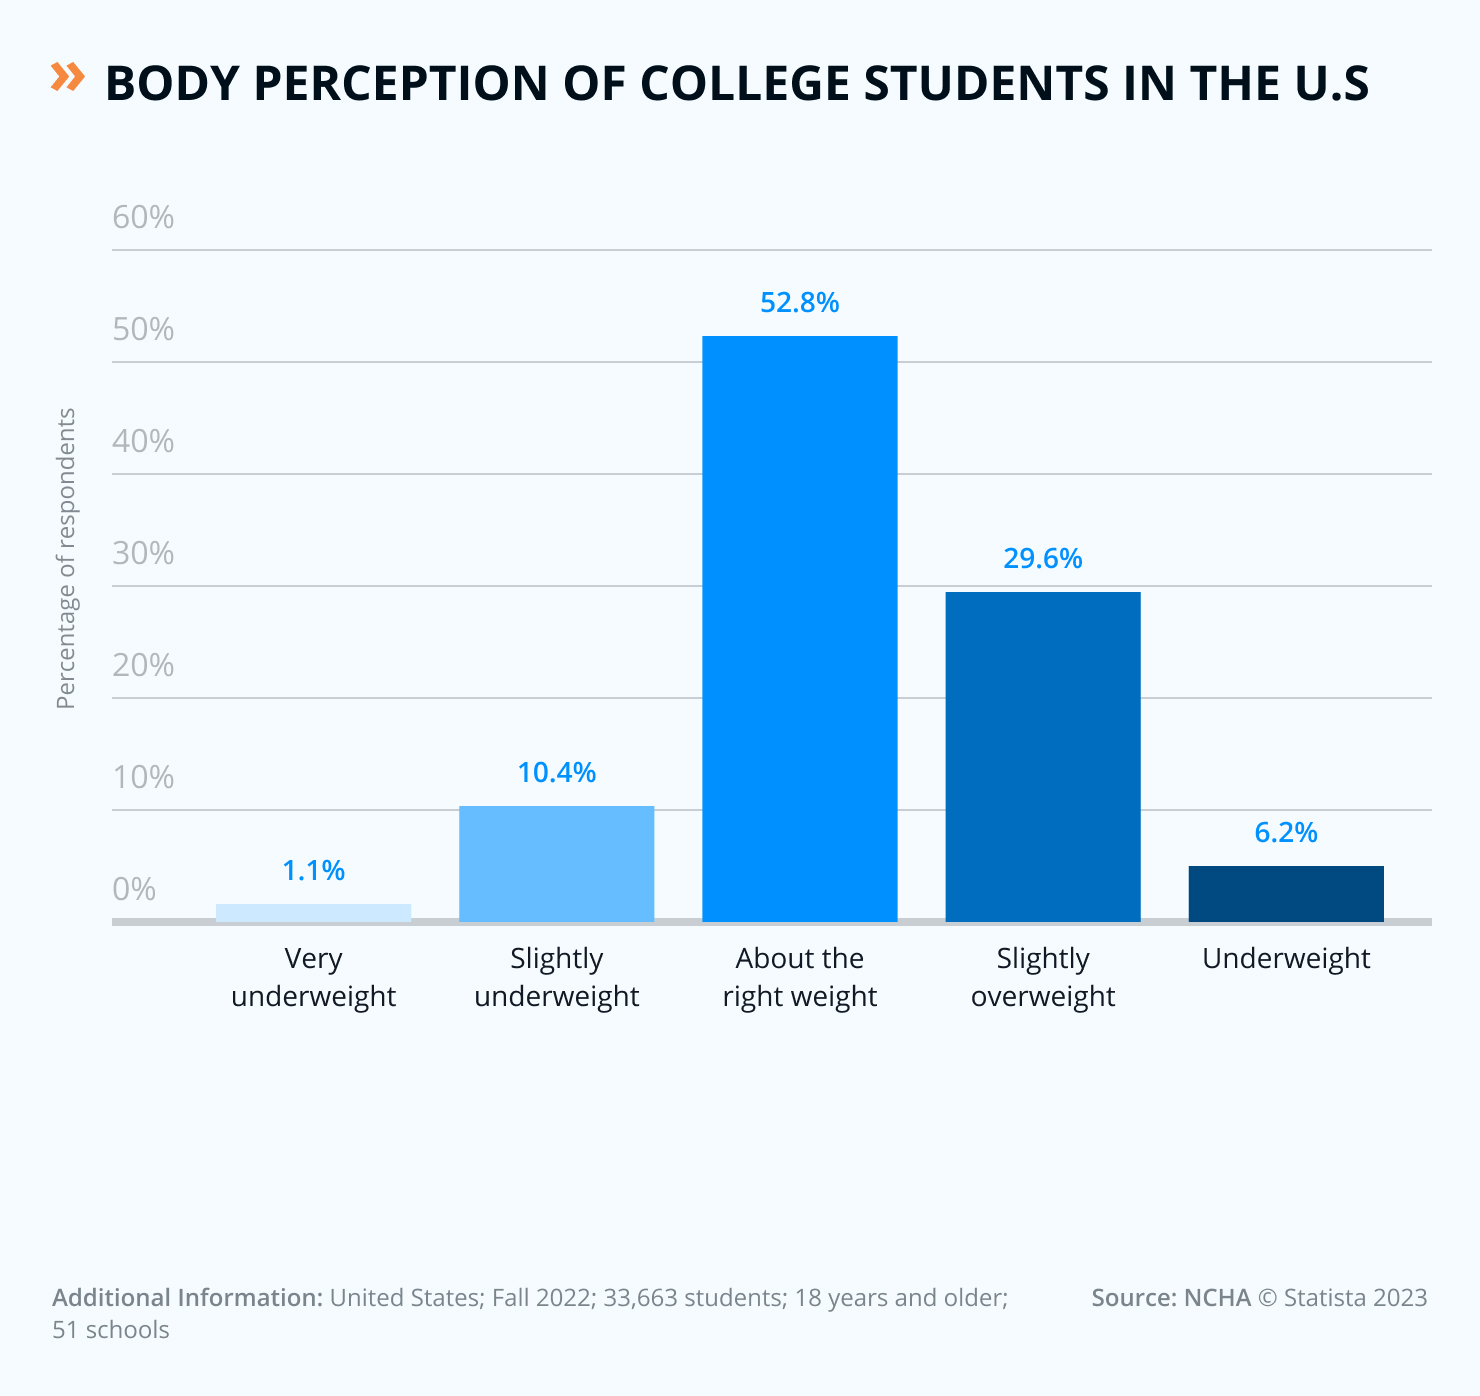
College students, typically young U.S. adults, also have perceptions of their weight status, as is given in the chart[8]. The statistics on the percentage of U.S. college students that described themselves as underweight or overweight as of fall of 2022 indicate that:
- Only 1.1% see themselves as very underweight.
- 10.4% as underweight.
- The largest percentage, 52.8%, perceived themselves as weighing just right.
- At 29.6%, slightly overweight
- Very overweight at 6.2%.
Again, just like the average person, college students also greatly perceive themselves as weighing just right at 52.8%. But if the weight trend is increasing among the population, it can indicate that people feel more comfortable at a higher weight. This can continue to result in an increased need for medical care for conditions aggravated by high weight.
Do U.S. People Try To Lose Weight?
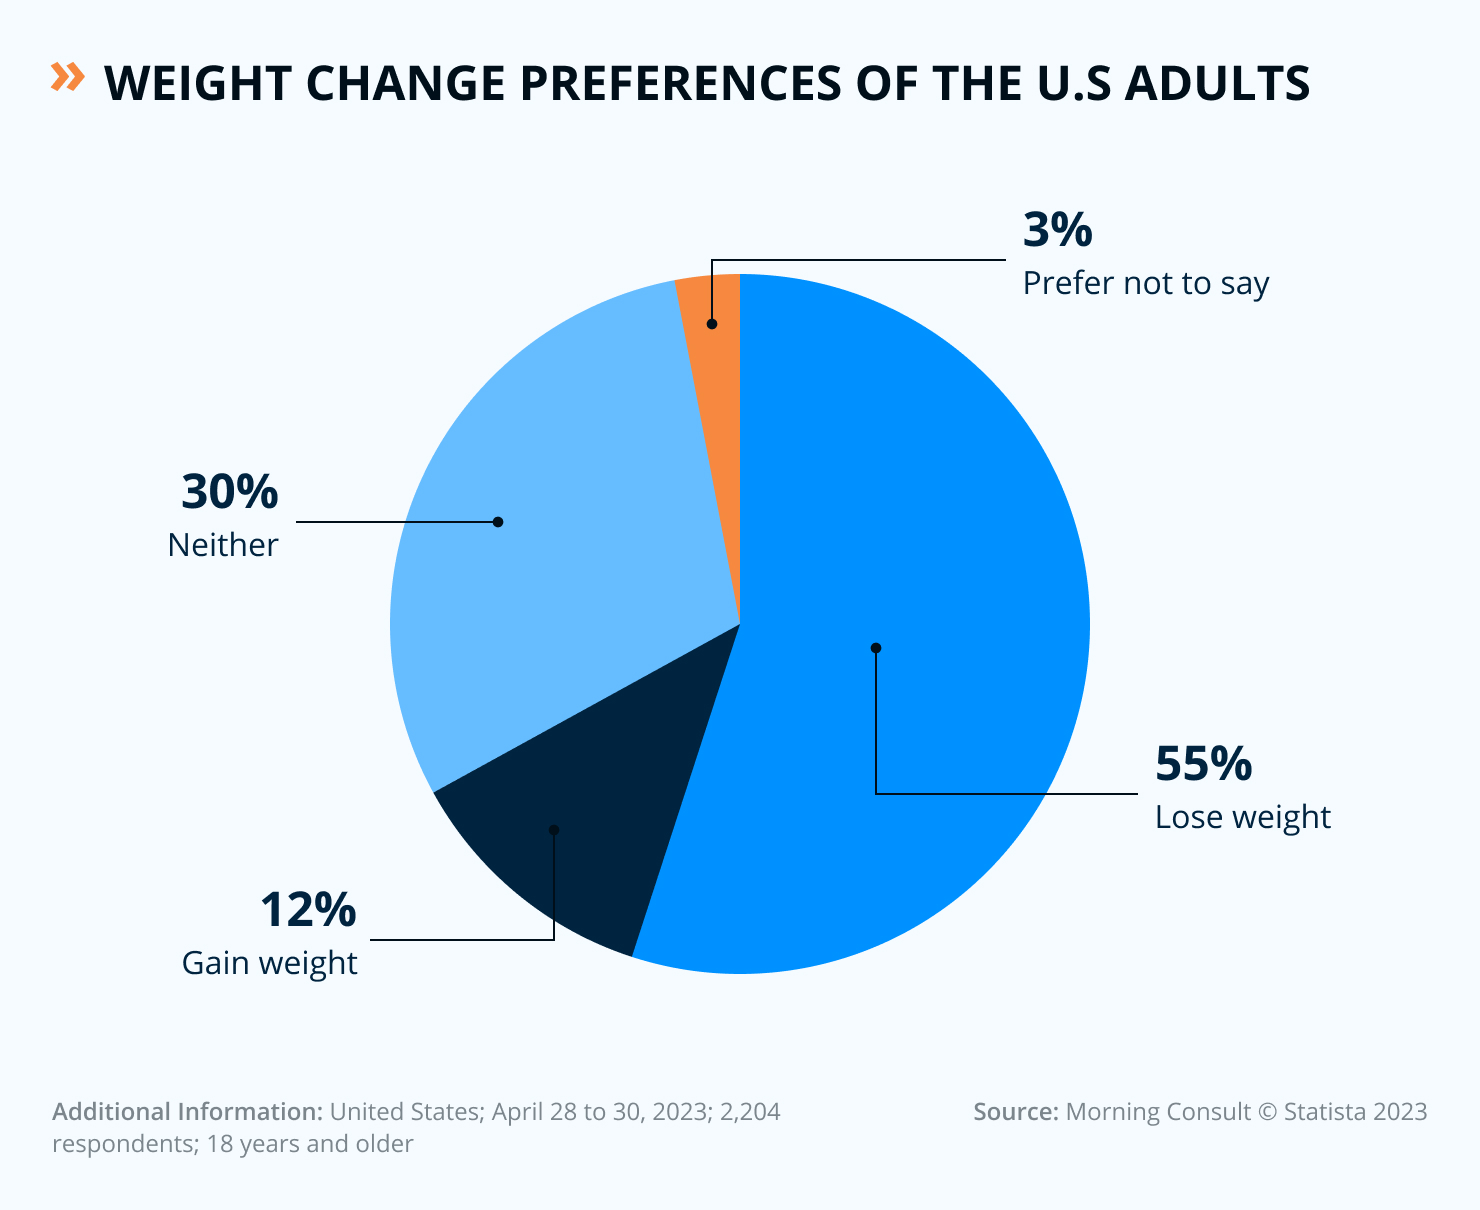
According to Statista[9], the percentage of adults in the United States who stated that they felt they needed to lose or gain weight as of 2023 varies significantly.
U.S. adults indicate to:
- Want to lose weight 55%
- 30% neither lose nor gain weight.
- 12% of people want to gain weight.
- 3% prefer not to say.
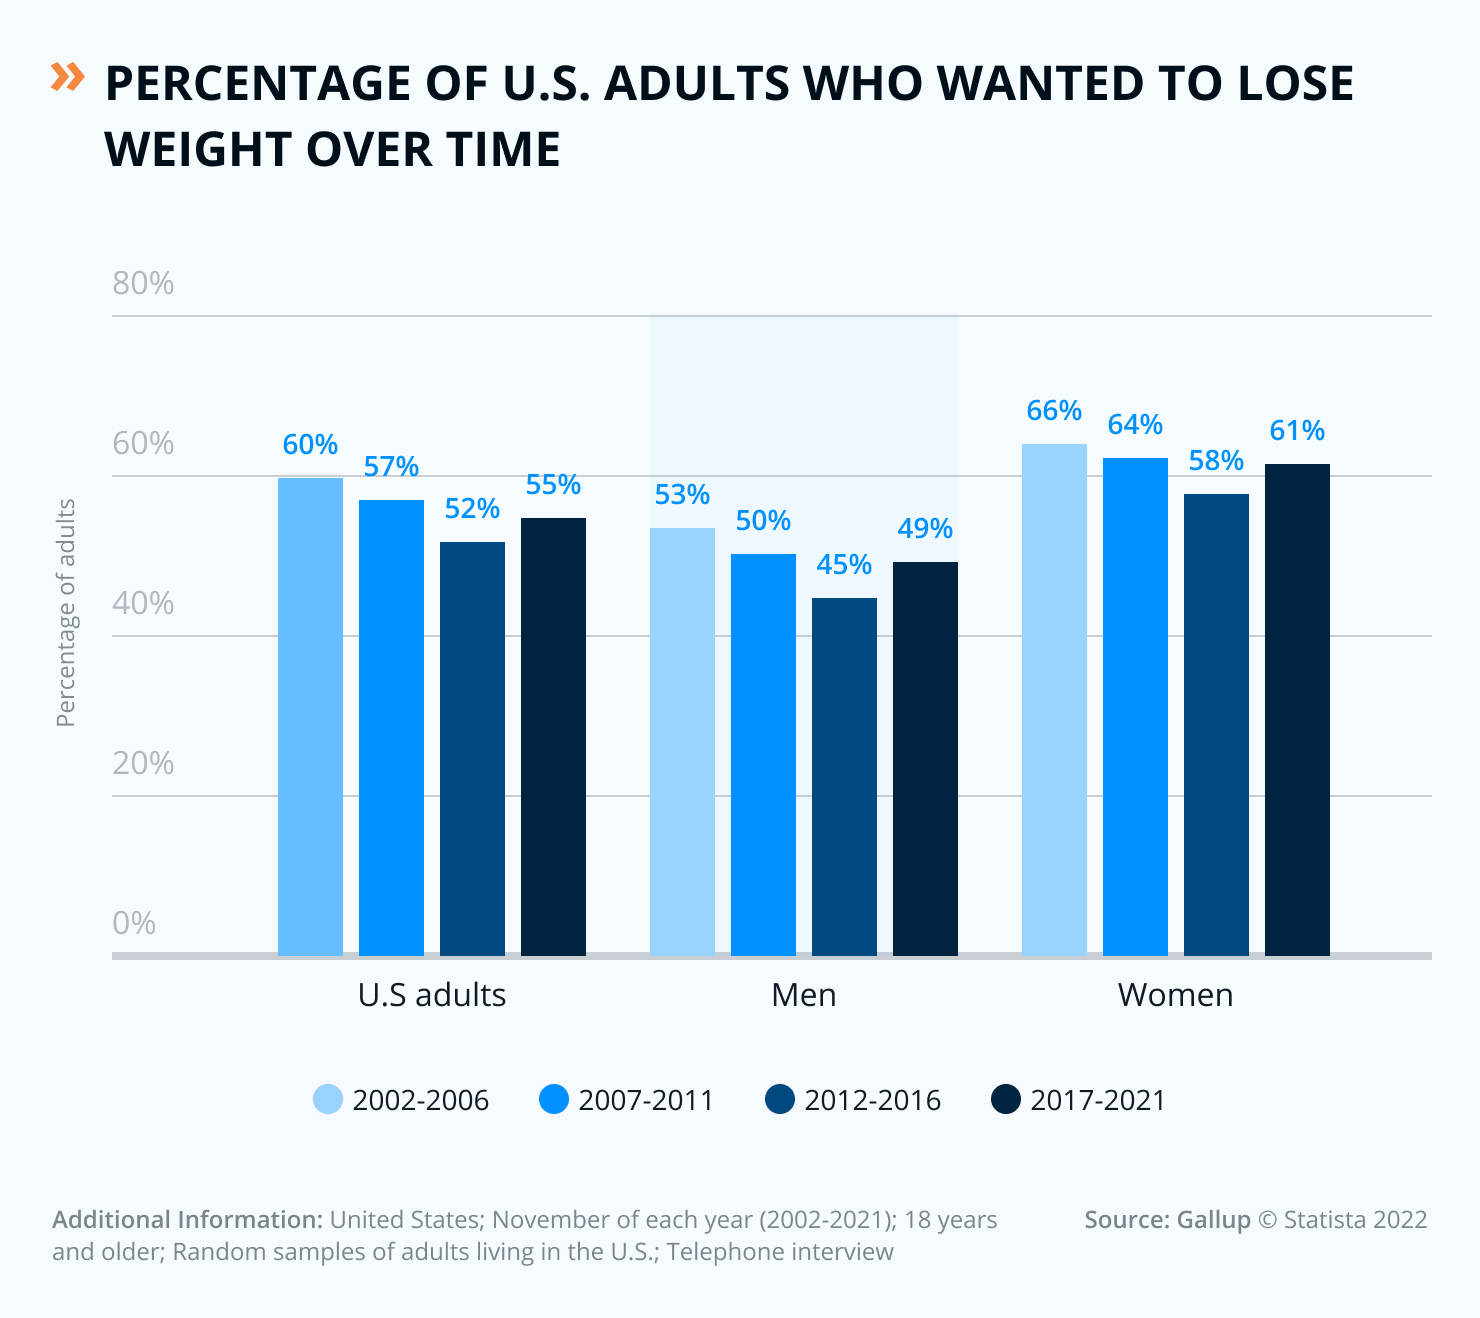
The chart[10] shows the percentage of U.S. adults who wanted to lose weight over time by gender in 2002-2021:
- 60% wanted to lose weight
- In those same years, males wanted to lose weight at 53%
- Females wanted to lose weight at 66%.
From 2017-2021, the average decreased in U.S adults who want to lose weight to 55%, men at 49% and women at 61%.
The trends of weight gain over the years are there, but the percentage of people wanting to lose weight is decreasing. It’s unknown what is causing people to decrease their desire not to want to lose weight, even though the average weight trend is increasing.
What Percentage Of Americans Are Obese?
Obesity is a growing problem in many countries around the world, but the United States has the highest rate of obesity among all OECD countries[11]. The prevalence of obesity in the United States[12] has risen steadily over the previous two decades with no signs of declining. Obesity in the U.S. is more common among women than men and overweight and obesity rates are higher among African Americans[13] than other races or ethnicities.
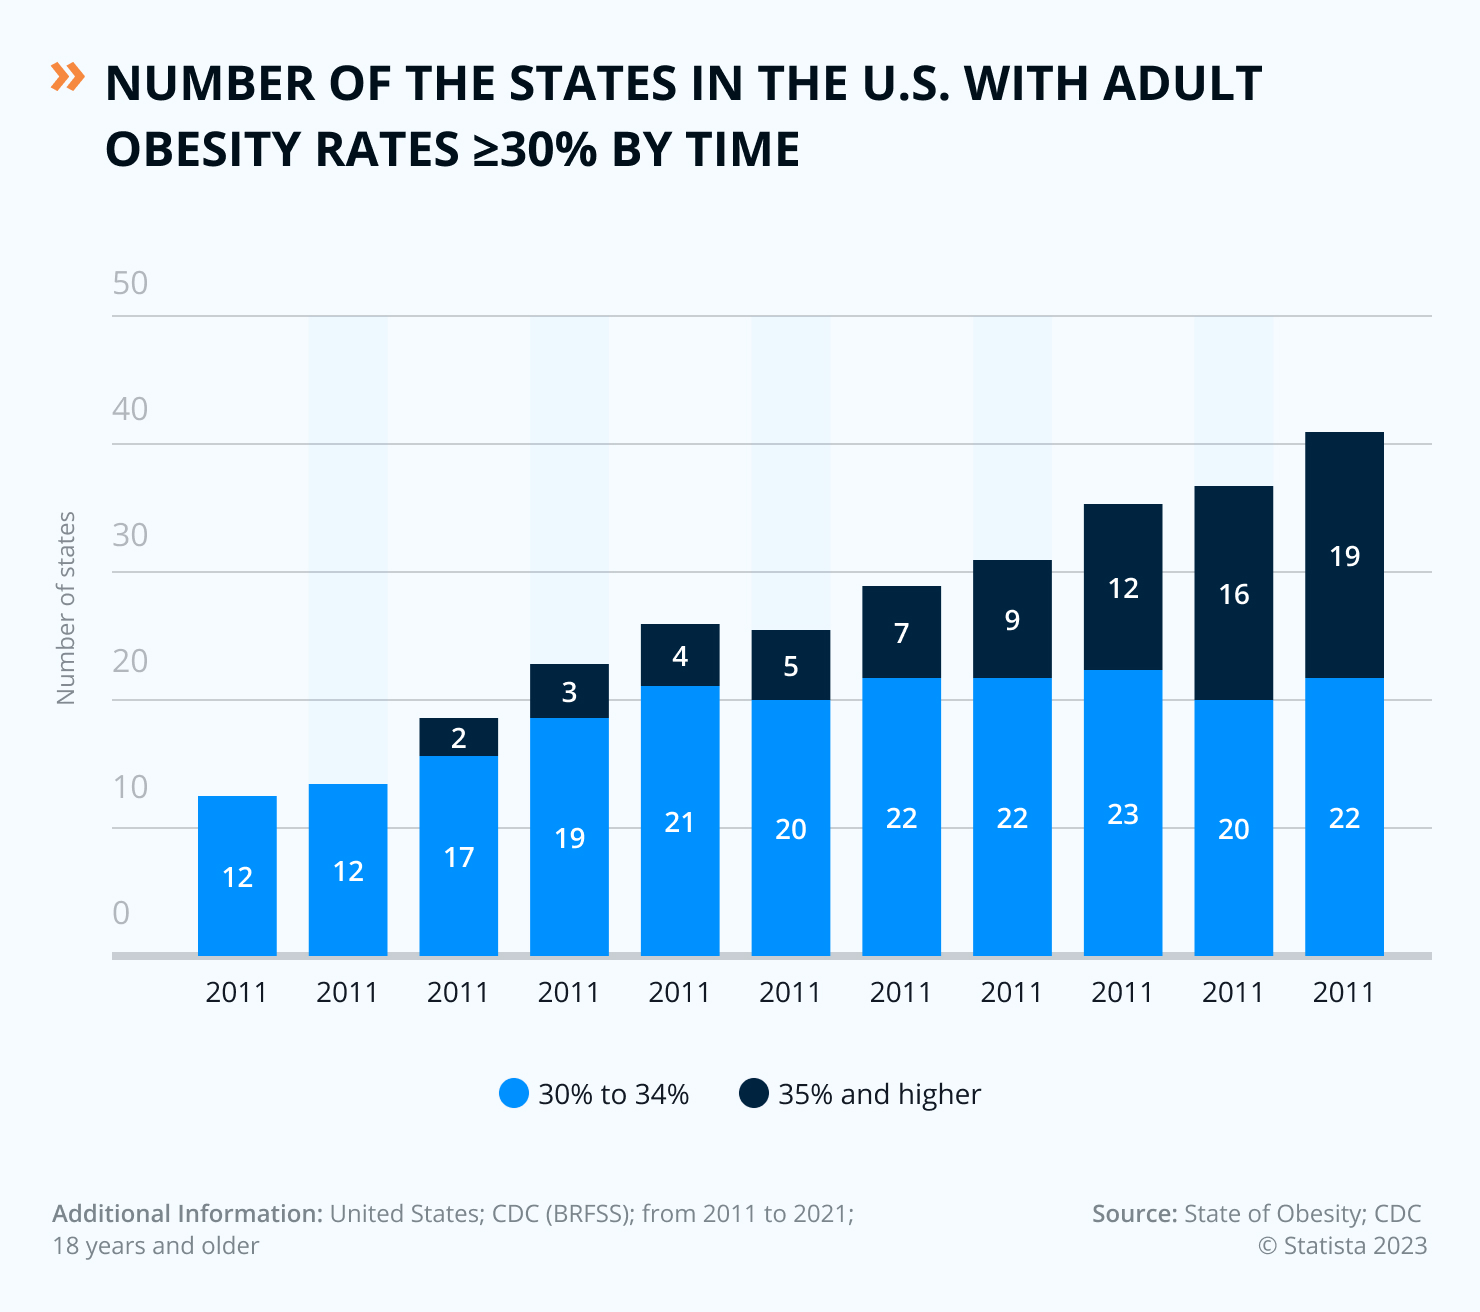
Rates of obesity per state have also increased over the years, especially rates higher than 35%.
As you can see in the chart, while 12 states had obesity rates at 30%[14] or higher in 2011, it increased to 41 states in 2021, which is an increase of 10 more states within ten years.
In 2021, there were no states with an obesity rate higher than 35%, but by 2021, there were 19 states in which the obesity rate was higher than 35%. This tells us that the obesity rate isn’t just growing among age or ethnicity and throughout the country.
This gives us the idea that there is a higher risk that the obesity rate in America will only continue to increase and become more severe if things don’t change.
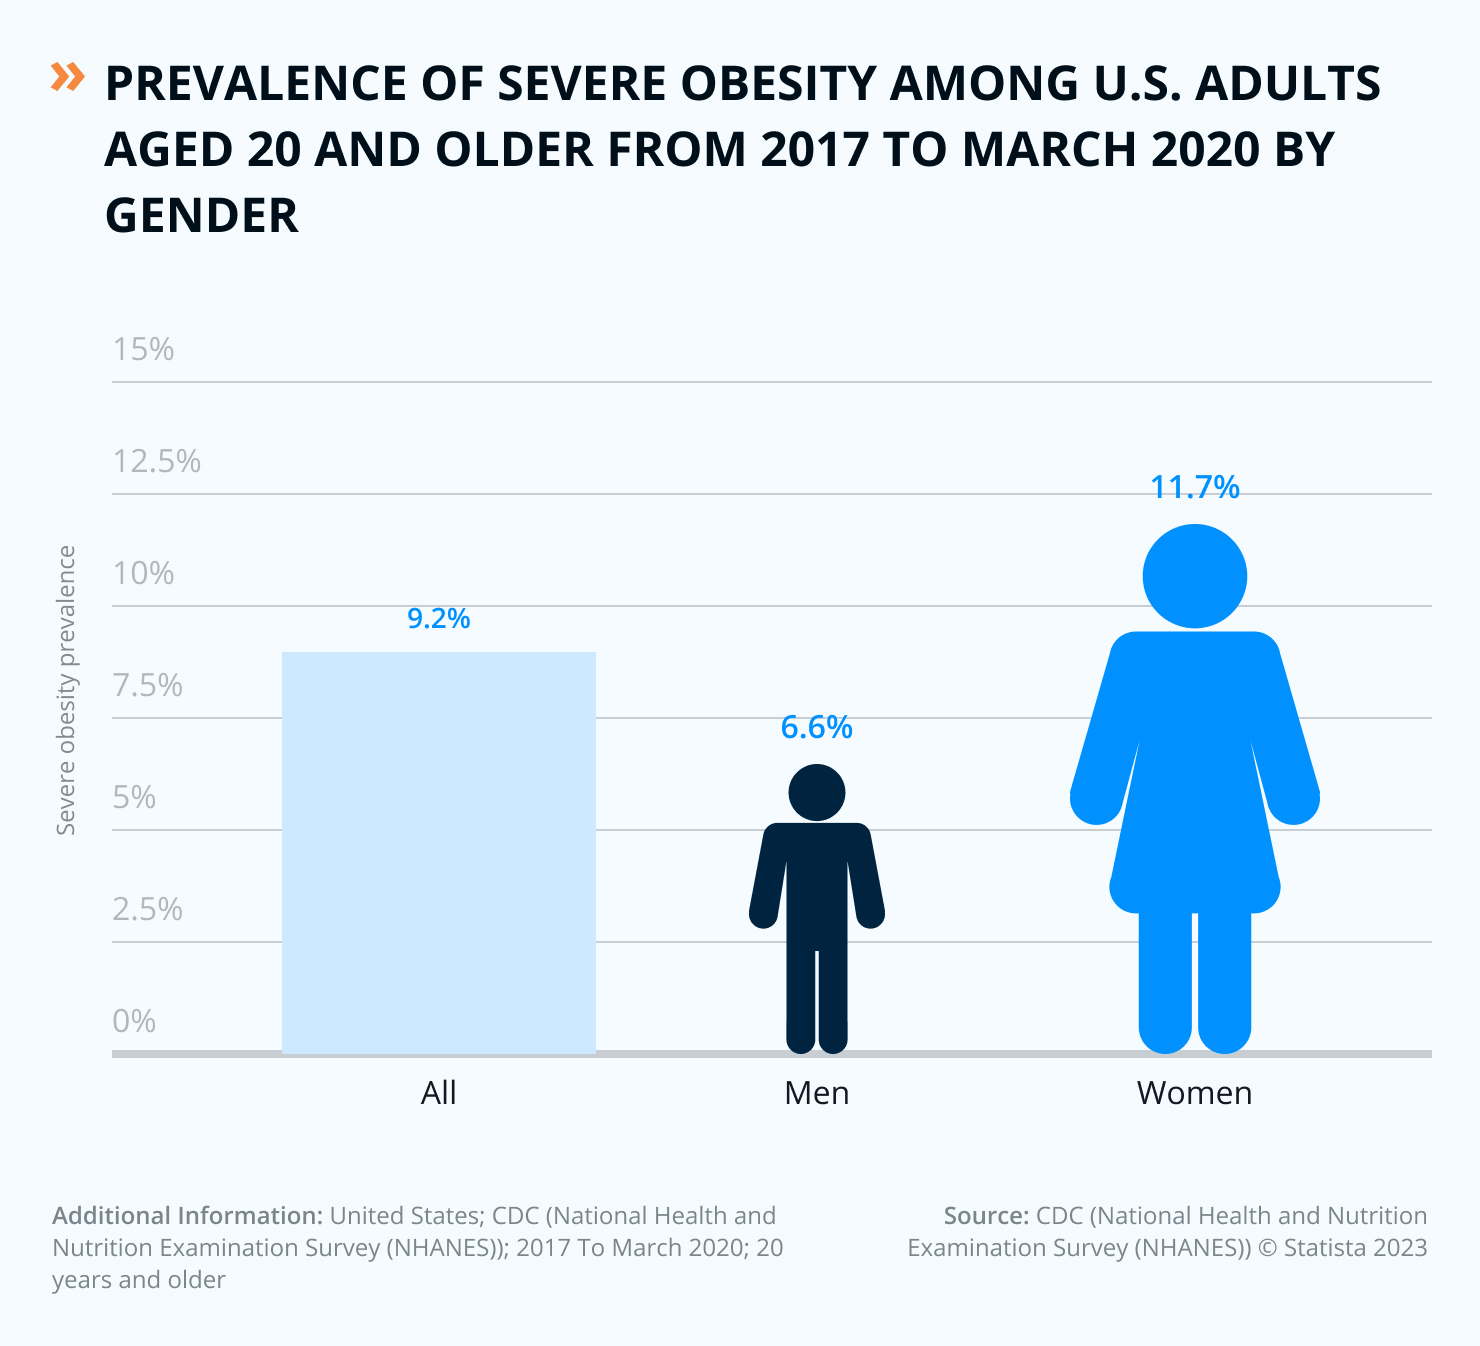
According to Statistica’s data[15] on the prevalence of severe obesity among U.S. adults aged 20 and older from 2017 to March 2020:
- By gender, there is a 9.2% risk of all adults having a prevalence of severe obesity.
- But in men, that rate is lower at 6.6%.
- For women, it jumps up to 11.7%.
There isn’t just the increased risk of gaining more weight than men, but women are at an increased prevalence of developing severe obesity. This is a situation that is only getting worse in the U.S., and women are at the forefront of being affected.
U.S. Adults Obesity Statistics
By State
Obesity rates by state give us a snapshot of where in the U.S. the prevalence of obesity is the highest. States with a high percentage of adults with obesity in the United States as of 2021 are:
- West Virginia at 40.6%[16].
- Kentucky has 40.3% of the population with obesity.
The states with the lowest percentage of adults with obesity are
- Not a state but the District of Columbia, the U.S. capital, at 24.7%
- Followed by the state of Hawaii at 25%.
The reasons for a high obesity rate or a low obesity rate can vary:
- Income levels
- Access to healthcare
- Education levels
- Perceived importance of health.
By Gender & Age Group
In weight, that means that the average self-reported weight among U.S. adults from 2002 to 2021 is from 174 pounds to 181 pounds given in the chart[17] showing.
- For males, that increases from 193 pounds to 199 pounds.
- For women, that is from 154 pounds to 163 pounds.

By Gender & Ethnicity
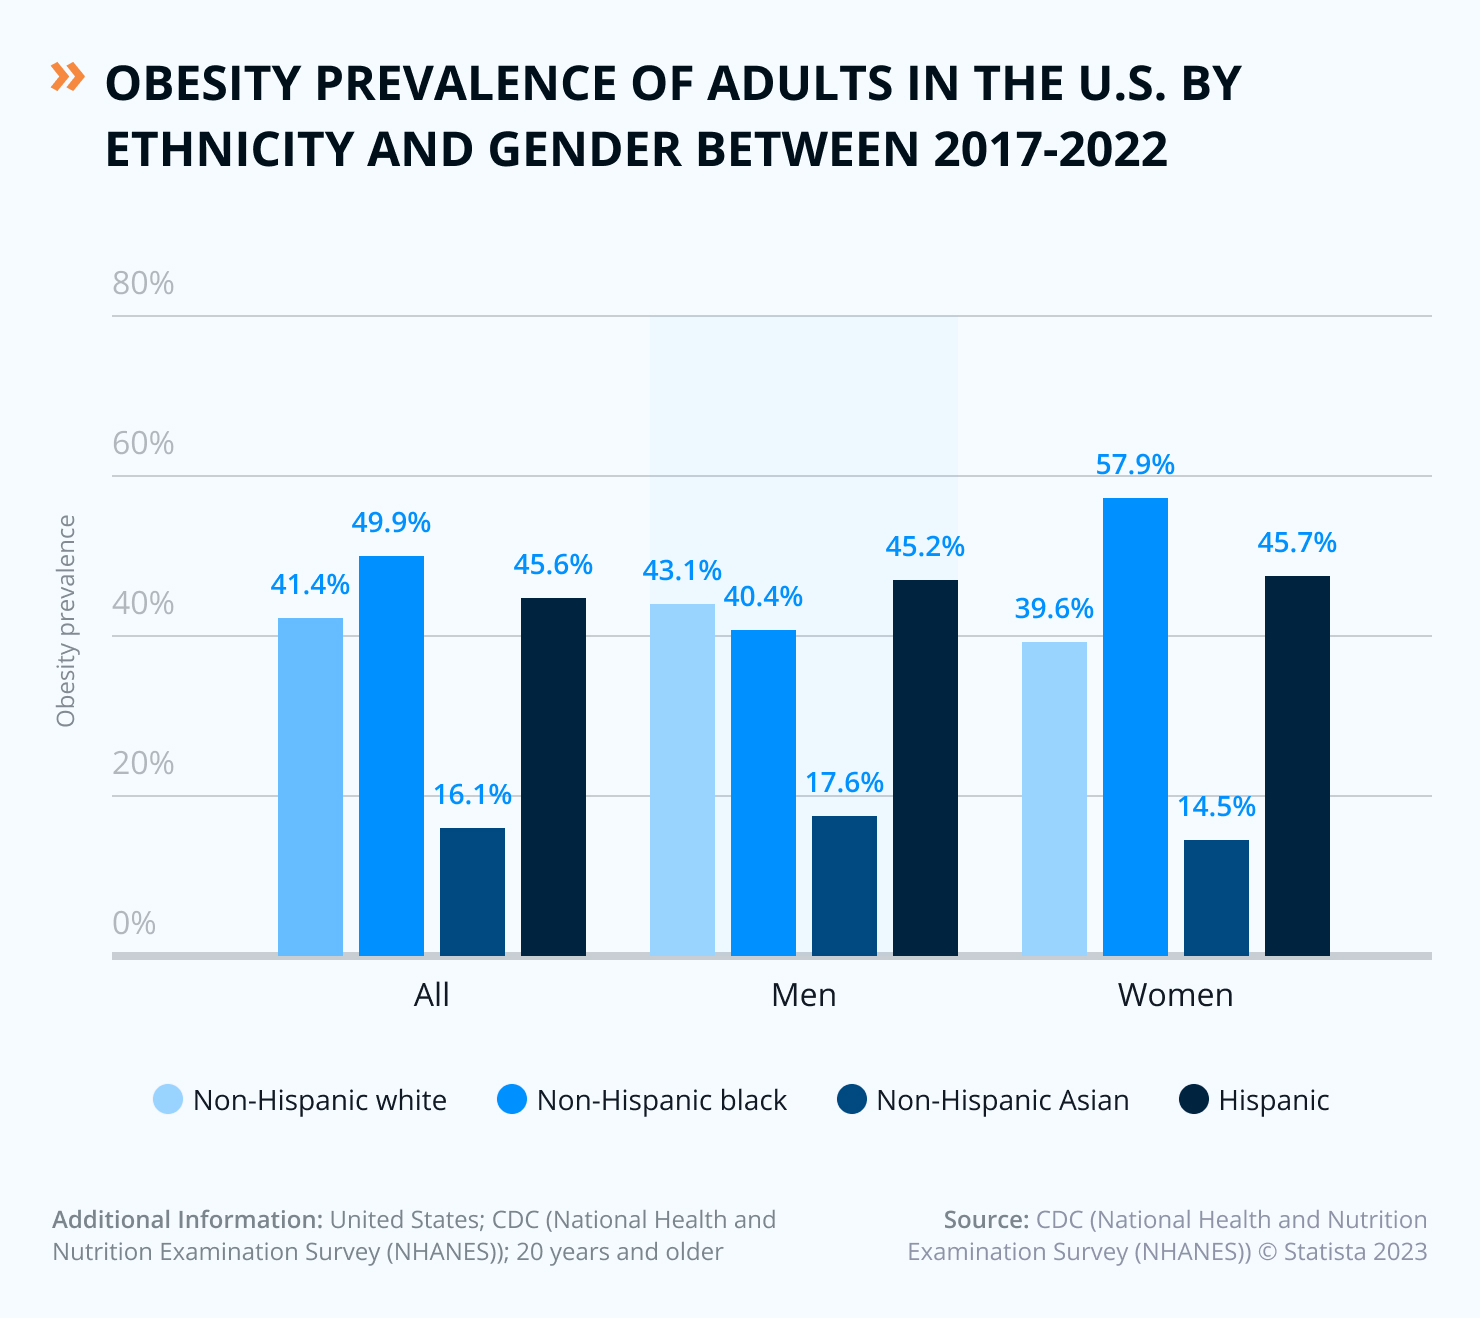
In the obesity prevalence[18] among U.S. adults from 2017 to March 2020, by gender and ethnicity:
- The non-Hispanic black population has the highest percentage at 49.9% among all ethnicities.
- Hispanic men have the highest obesity prevalence at 45.2%
- Non-Hispanic black women have the highest obesity prevalence at 57.9%.
The second group in obesity prevalence among all ethnicities are
- Hispanic adults at 45.6%.
- Non-Hispanic white men at 43.1%.
- Hispanic women at 45.7%.
Among the non-Hispanic population, the lowest prevalence of obesity is the non-Hispanic Asian adults across the board.
Diet For Weight Loss – Do US People Care?
Are Americans aware of the increasing overweight and obesity rates?
If they are, do they care? And do they know how to lose weight?
Many who are already experiencing the increasing trends in their lives may also already start seeing how obesity affects their lives.
They may already have increasing obesity-related conditions that are also chronic diseases like
- Insulin resistance.
- Diabetes.
- High blood pressure.
- Kidney issues.
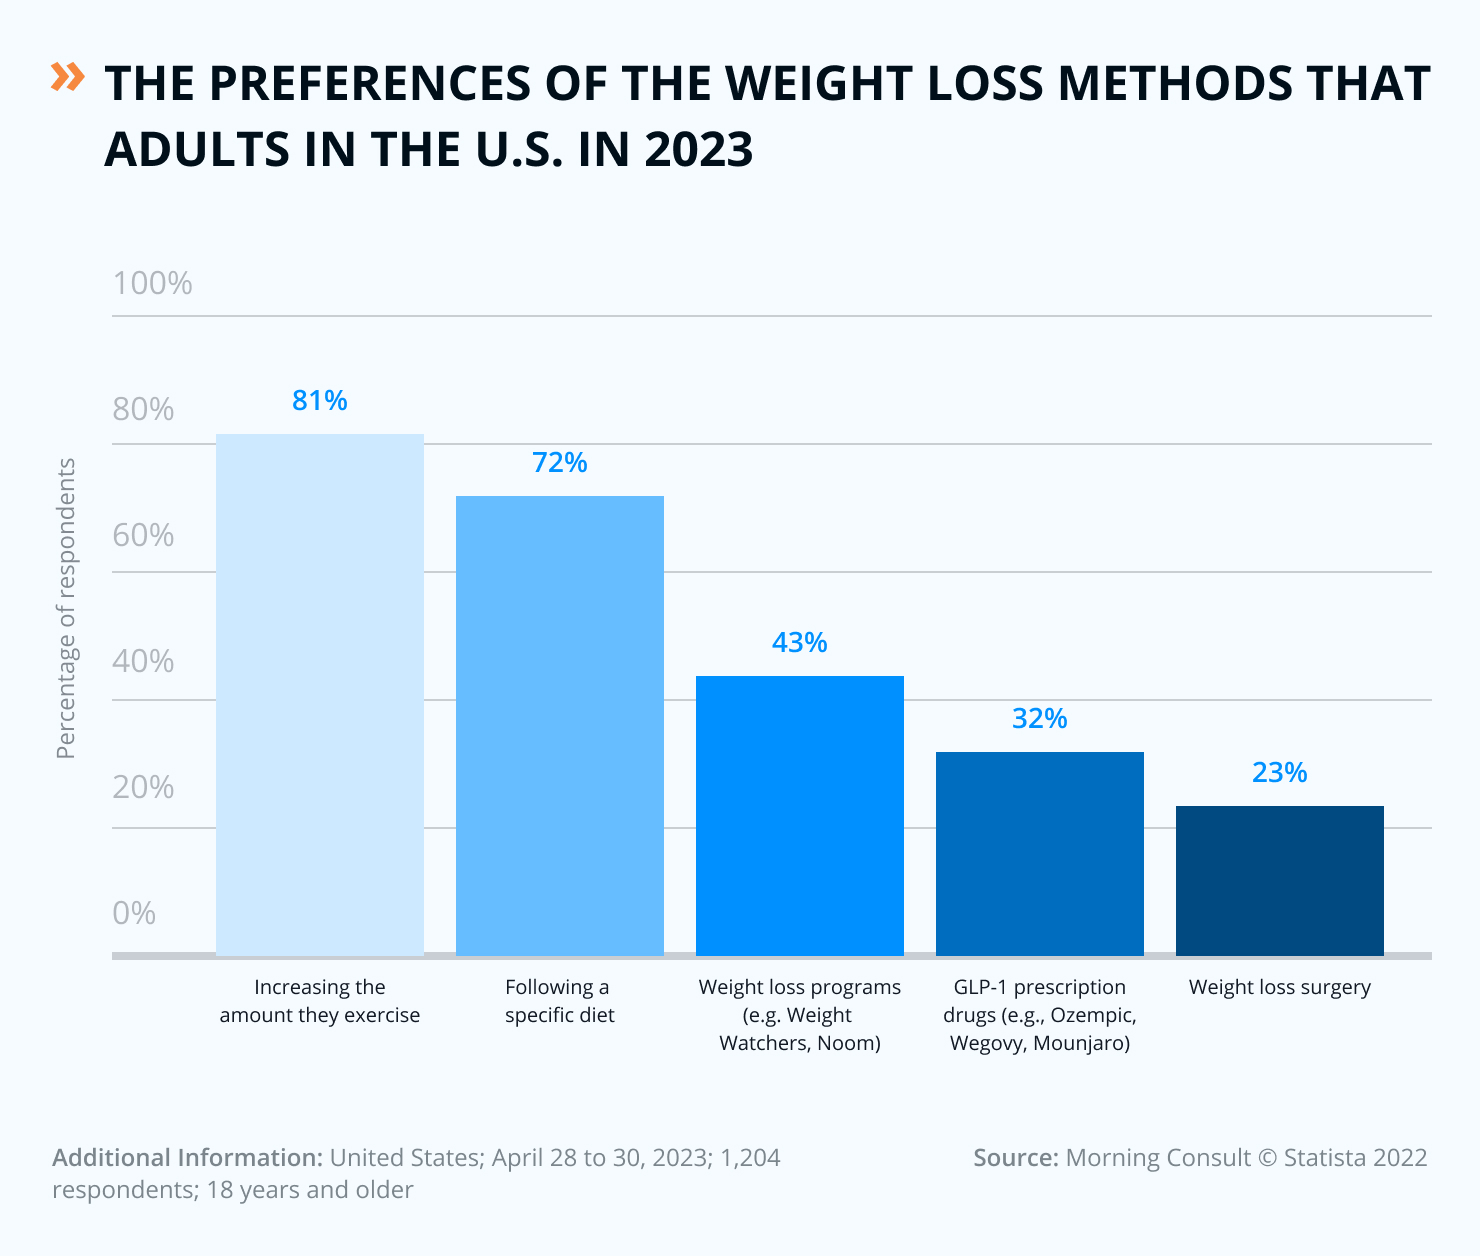
In the chart[19], of the percentage of adults in the United States who felt they needed to lose weight and who were interested in trying to select weight loss methods as of 2023:
- 81% were willing to increase their exercise, which is great considering that exercise is important for a healthy weight.
- Also, 72% were willing to follow a specific diet; the best diet for weight loss depends on the individual.
- But when it comes to following a specific program like Weight Watchers or Noom, it decreased to 43%.
- Adults were less likely to start prescription drugs at 32% and weight loss surgery at 23%.
This data shows that people are more willing to exercise and follow a diet for improved health. But are less likely to join a paid program or have medical interventions.
Top Reasons US People Watching Their Diet
But if people are willing to lose weight, why would they do it?
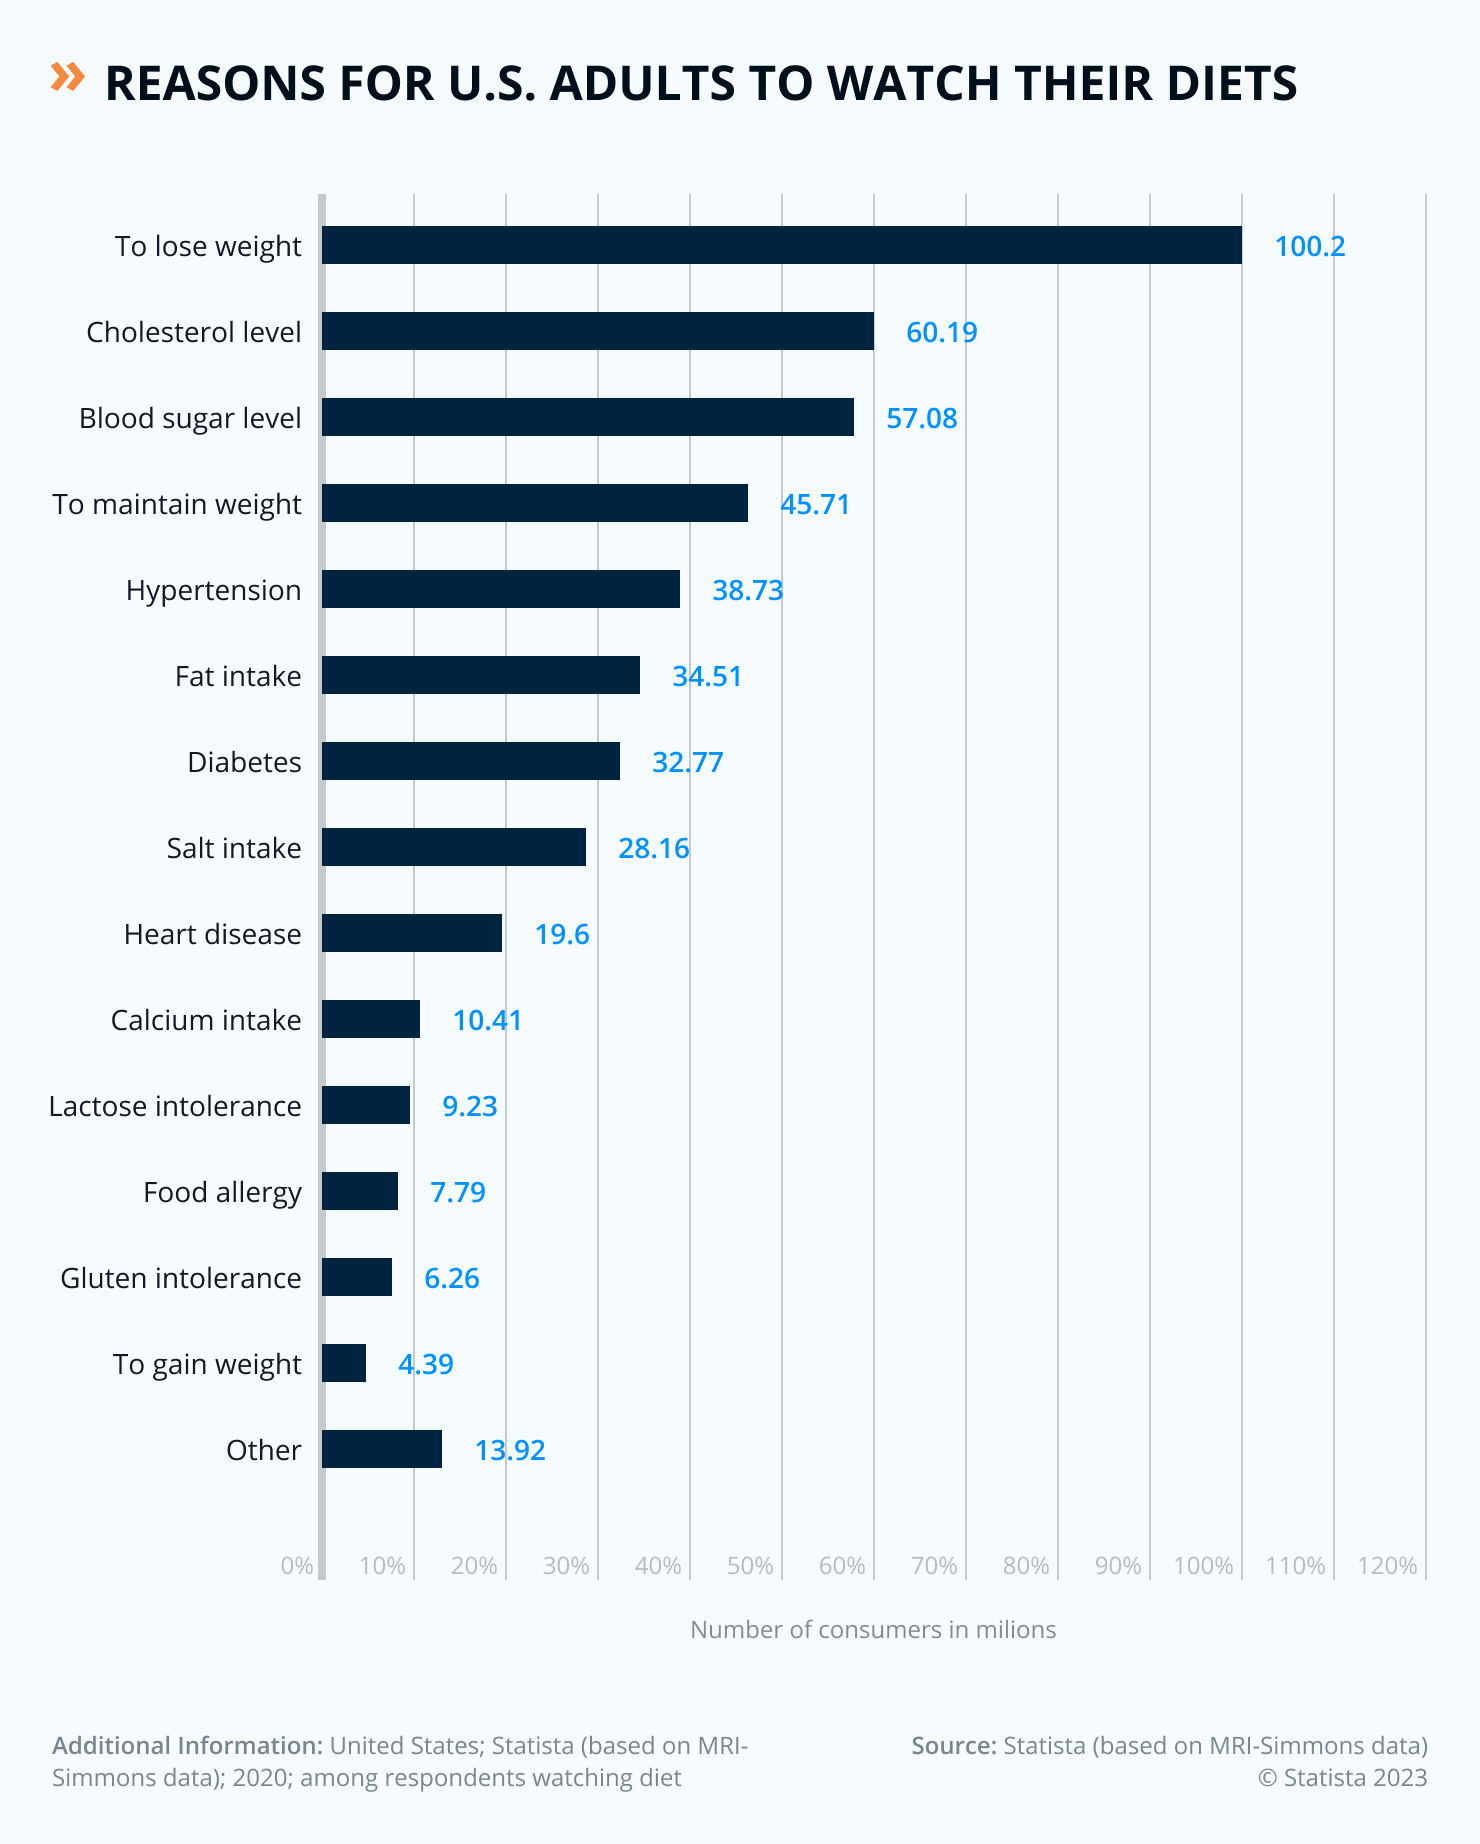
According to the survey[20] U.S. population: What are the reasons for watching your diet?
- 100.2 million people stated they watched their diet to lose weight.
- 60.9 million to decrease cholesterol levels.
- 57.08 million to control blood sugar levels.
- 45.71 million to maintain weight.
These are all good reasons to watch a diet; losing weight makes a person feel good and confident, but it also contributes to improved health, such as lowering blood sugar or cholesterol levels.
Types Of Food US People Buy When Watching Diets
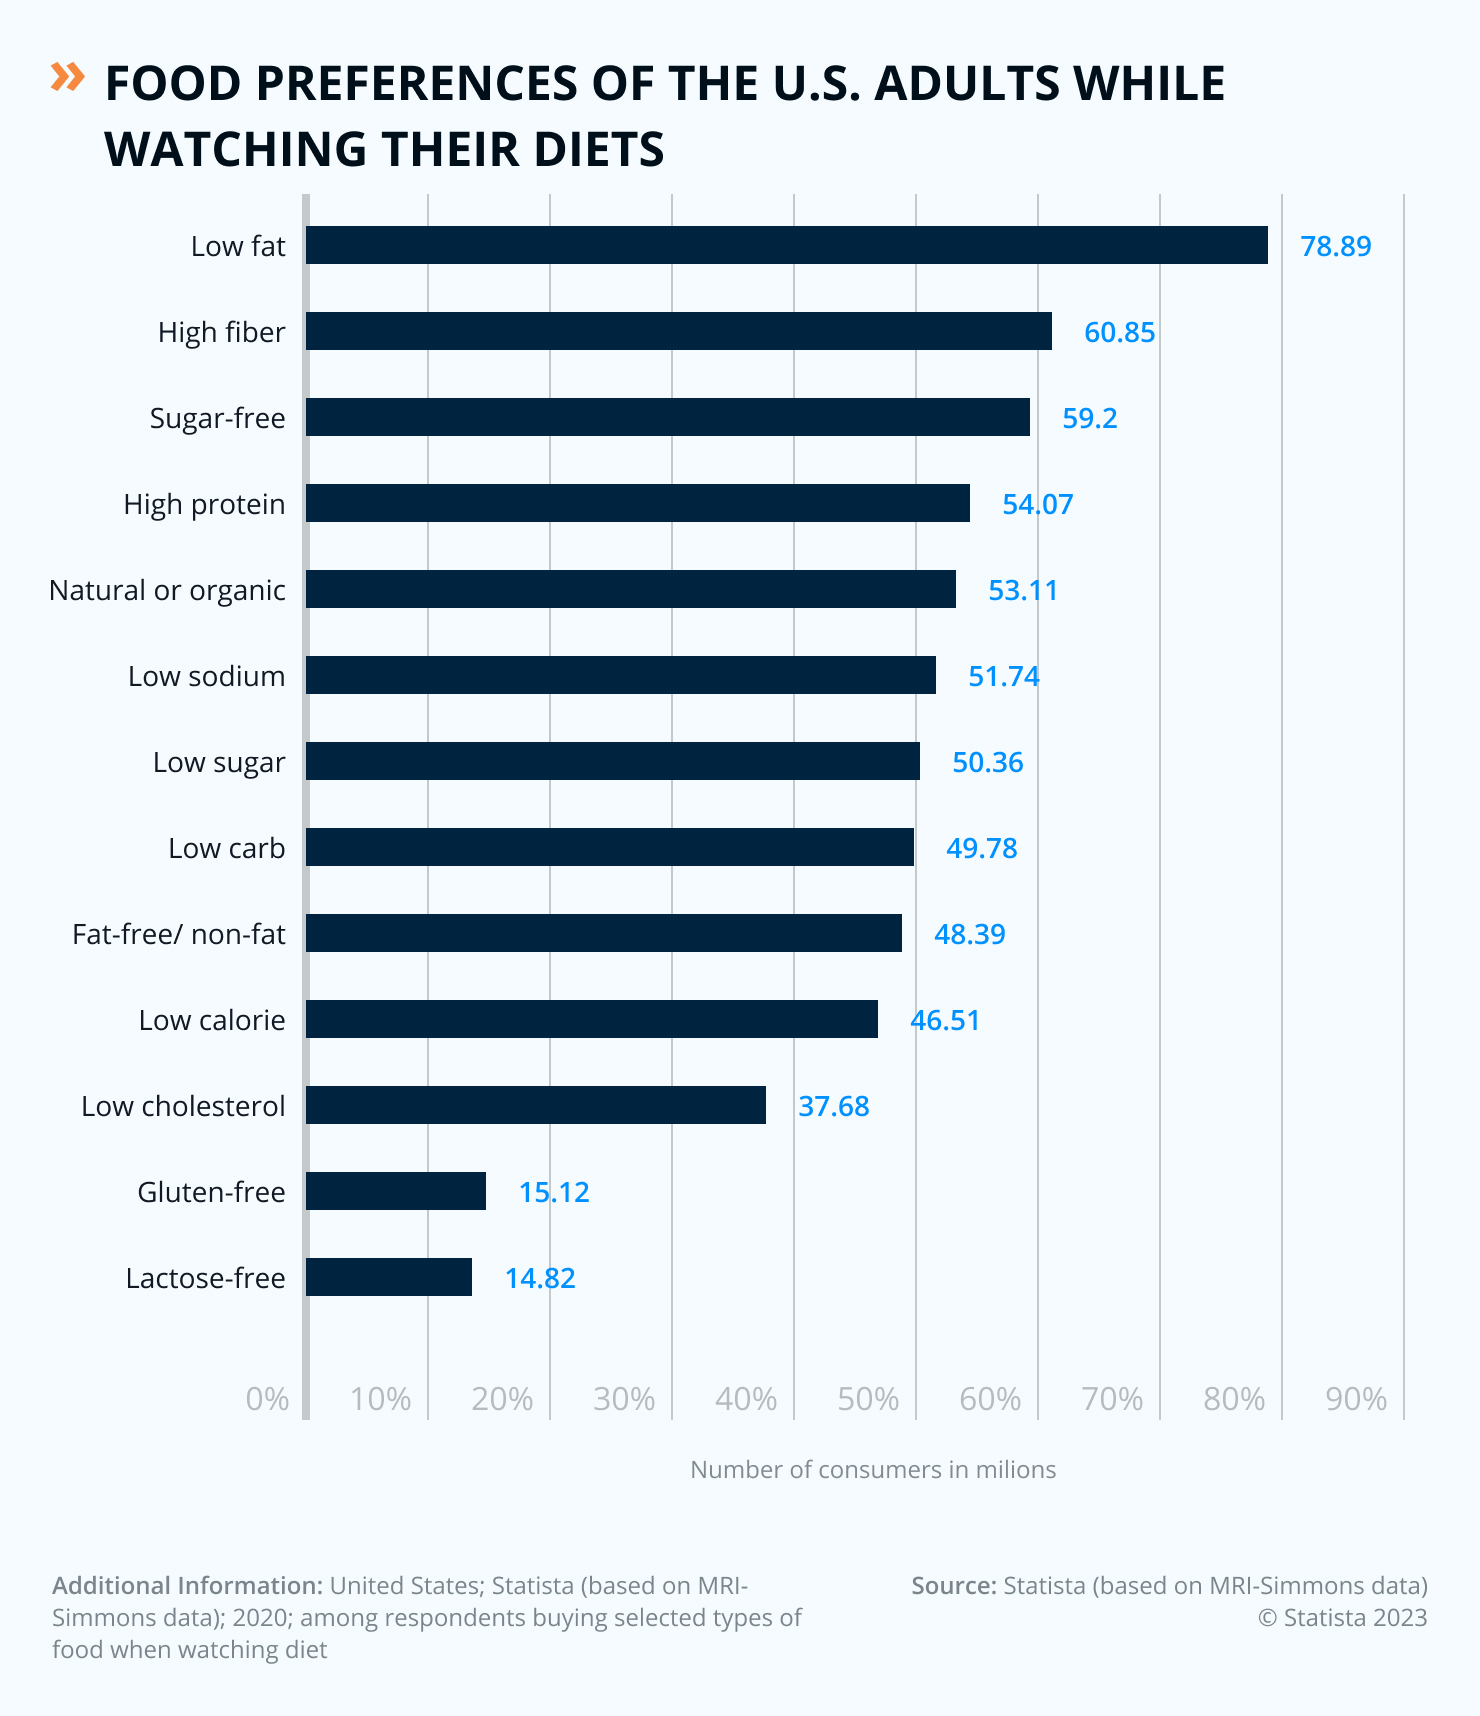
Finding the right balance of food intake to lose weight has much to do with what a person buys at a grocery store.
The survey[21] shows an awareness that low-fat foods can help with watching a diet. With low-fat foods being the top reason, 78.89 million people stated that is the first thing they think about when buying foods while watching their diet. It’s followed by purchasing foods high in fiber, sugar-free, high protein, natural or organic, low sodium, low sugar, low carb, fat-free/non-fat, low calories, low cholesterol, gluten-free, and lactose-free.
Top Reason For Dietary Supplement Use By Gender
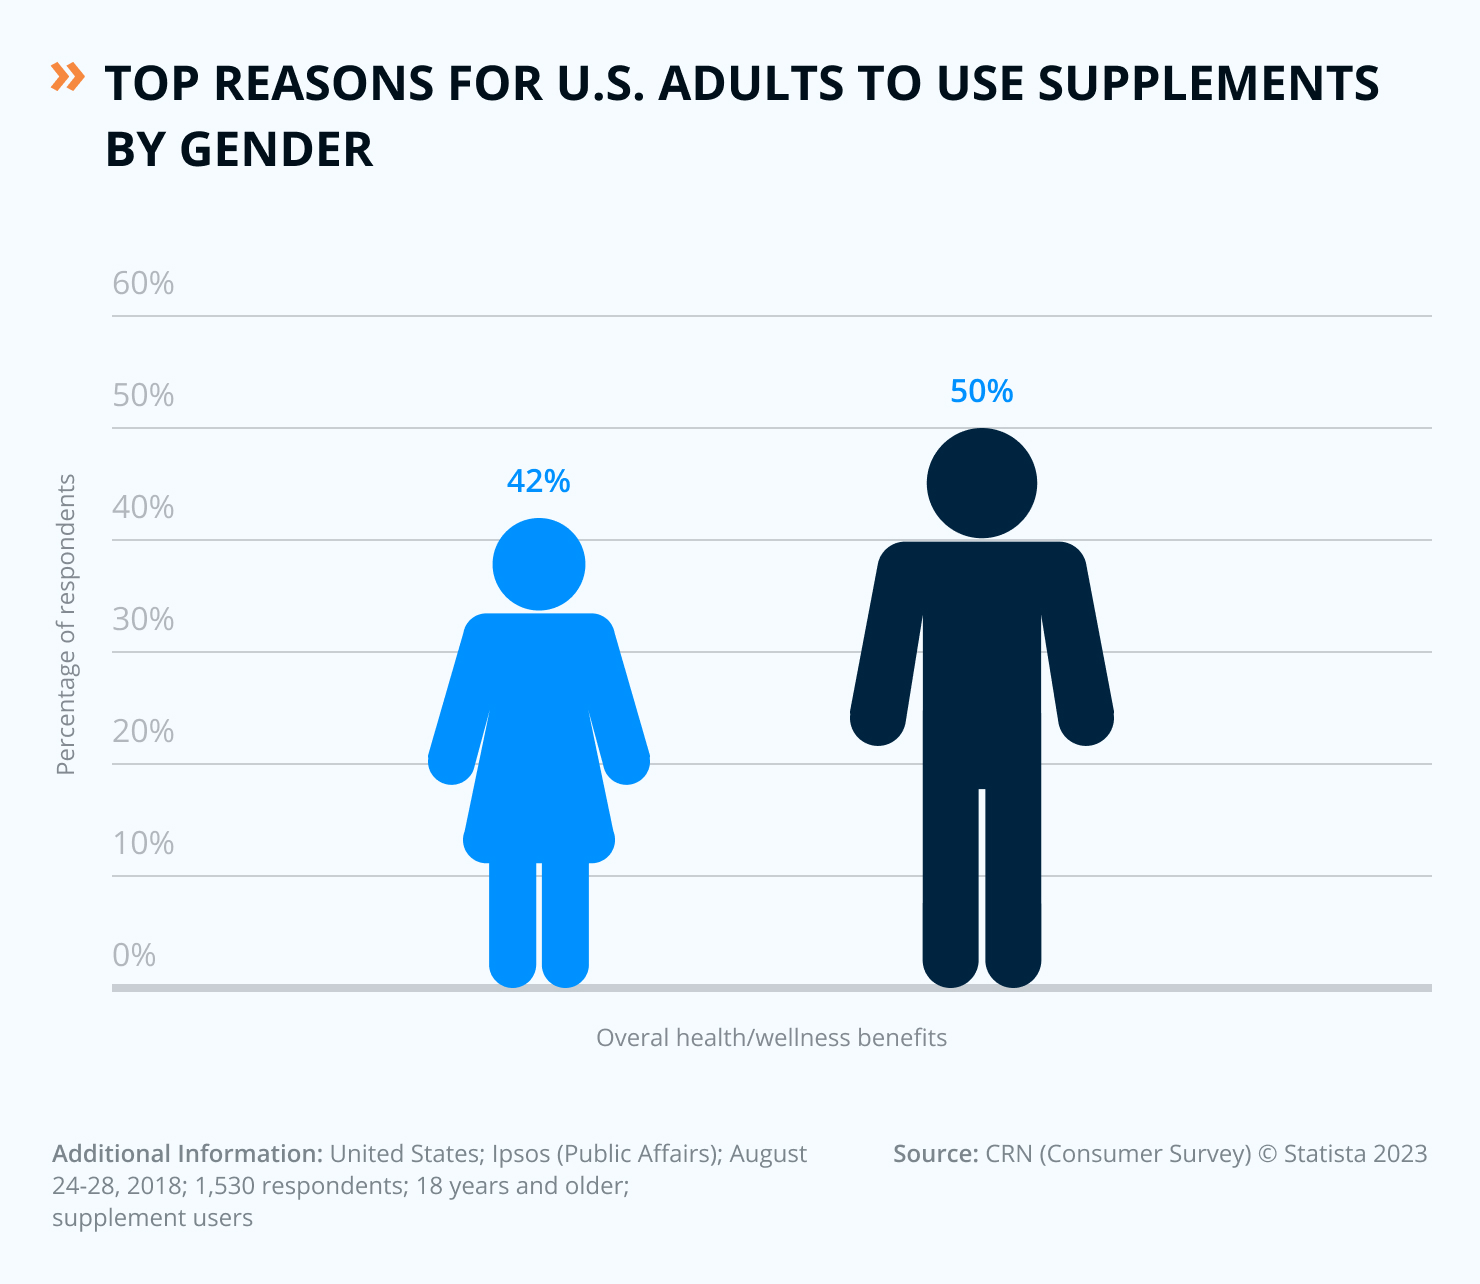
Some may even include supplement use as people search for a healthier lifestyle. The chart[22] shows the top reasons for U.S. adults to use supplements by gender.
Taking supplements:
- Males at 42%.
- Women at 50%.
Supplements help people feel that they are closing a nutritional gap if they are not consuming enough nutritious foods.
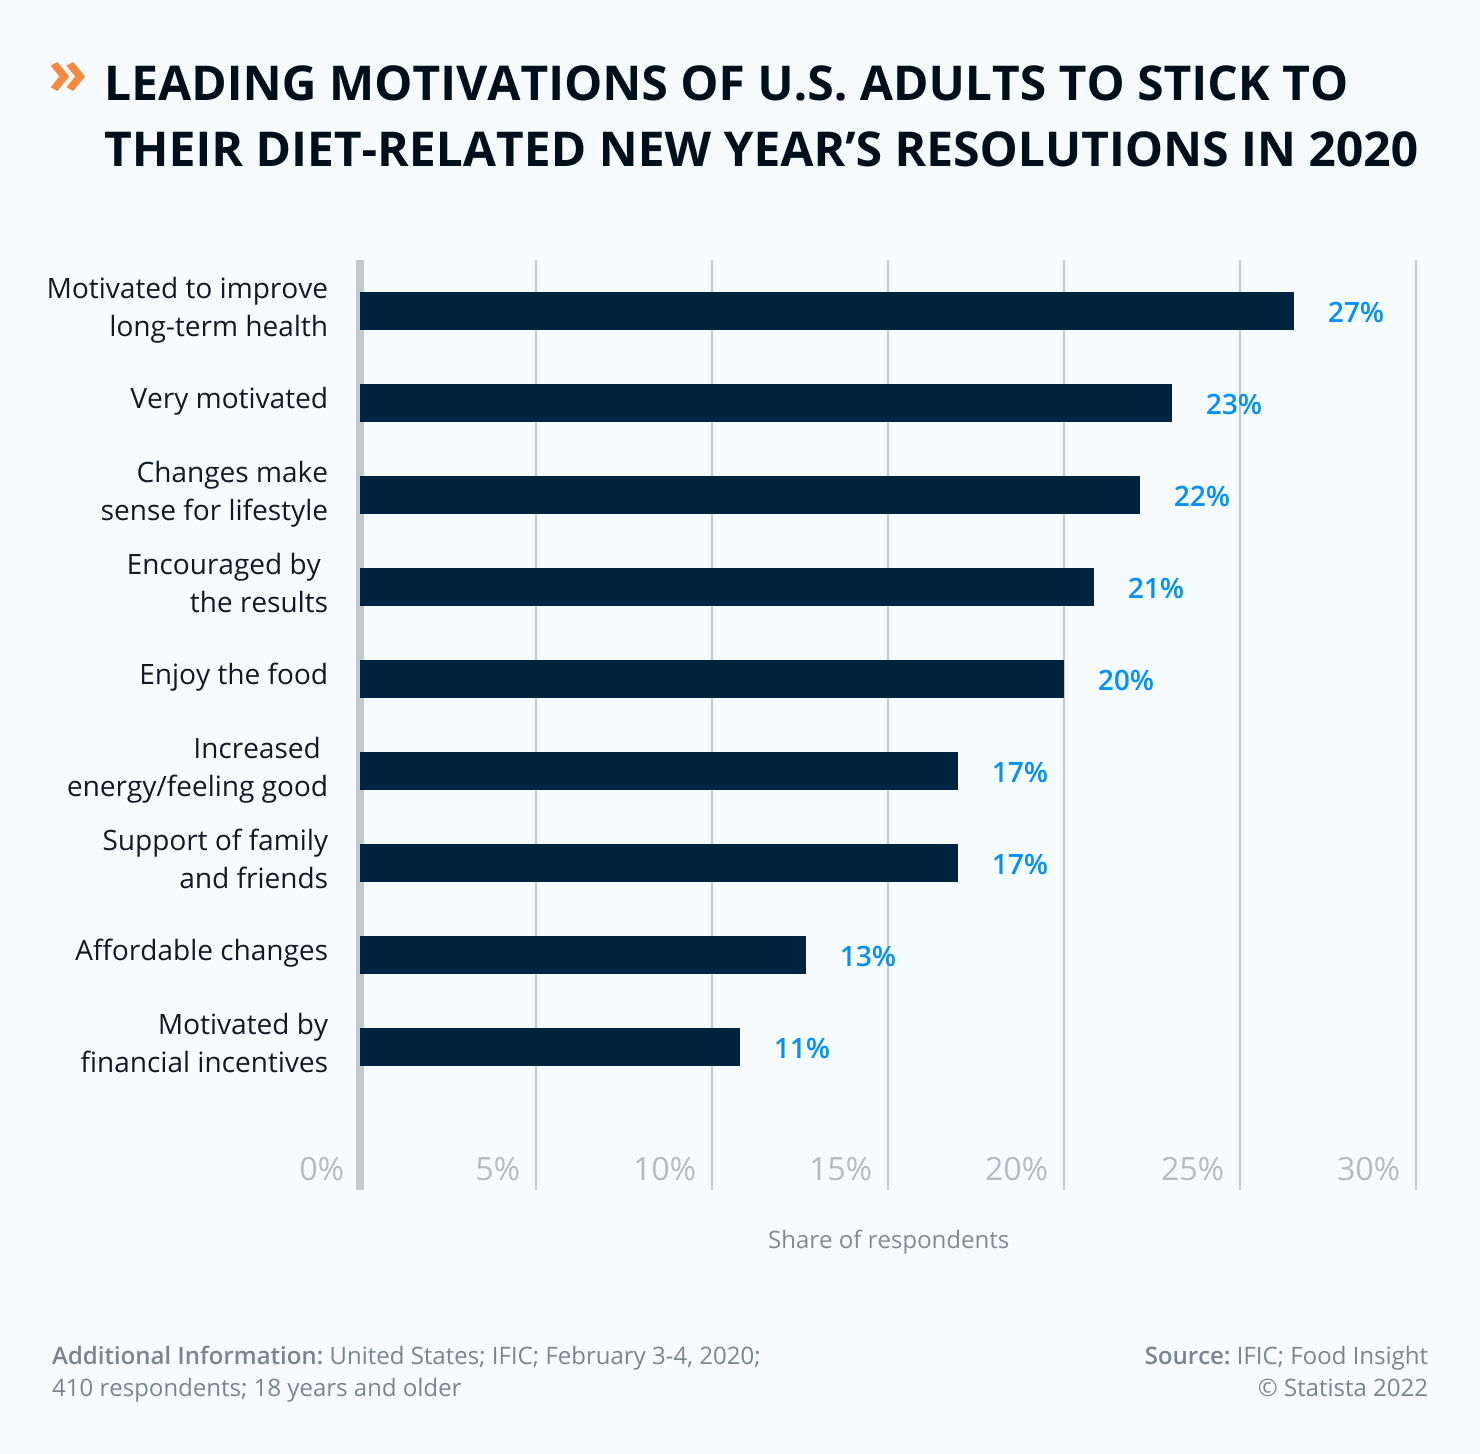
Leading Motivations To Stick To Diet-Related New Year’s Resolution
As the New Year starts, the idea of getting healthy is at its peak, the top motivation is to improve long-term health at 27%[23].
A new year is an opportunity to hit the refresh button and think of long-term goals, and long-term health is at the top of the list for motivations to stick to a diet.
Leading Obstacles To Stick To Diet-Related New Year’s Resolution
A person may have all the best intentions and motivations, but obstacles may hinder sticking to a diet related to a New Year’s resolution.
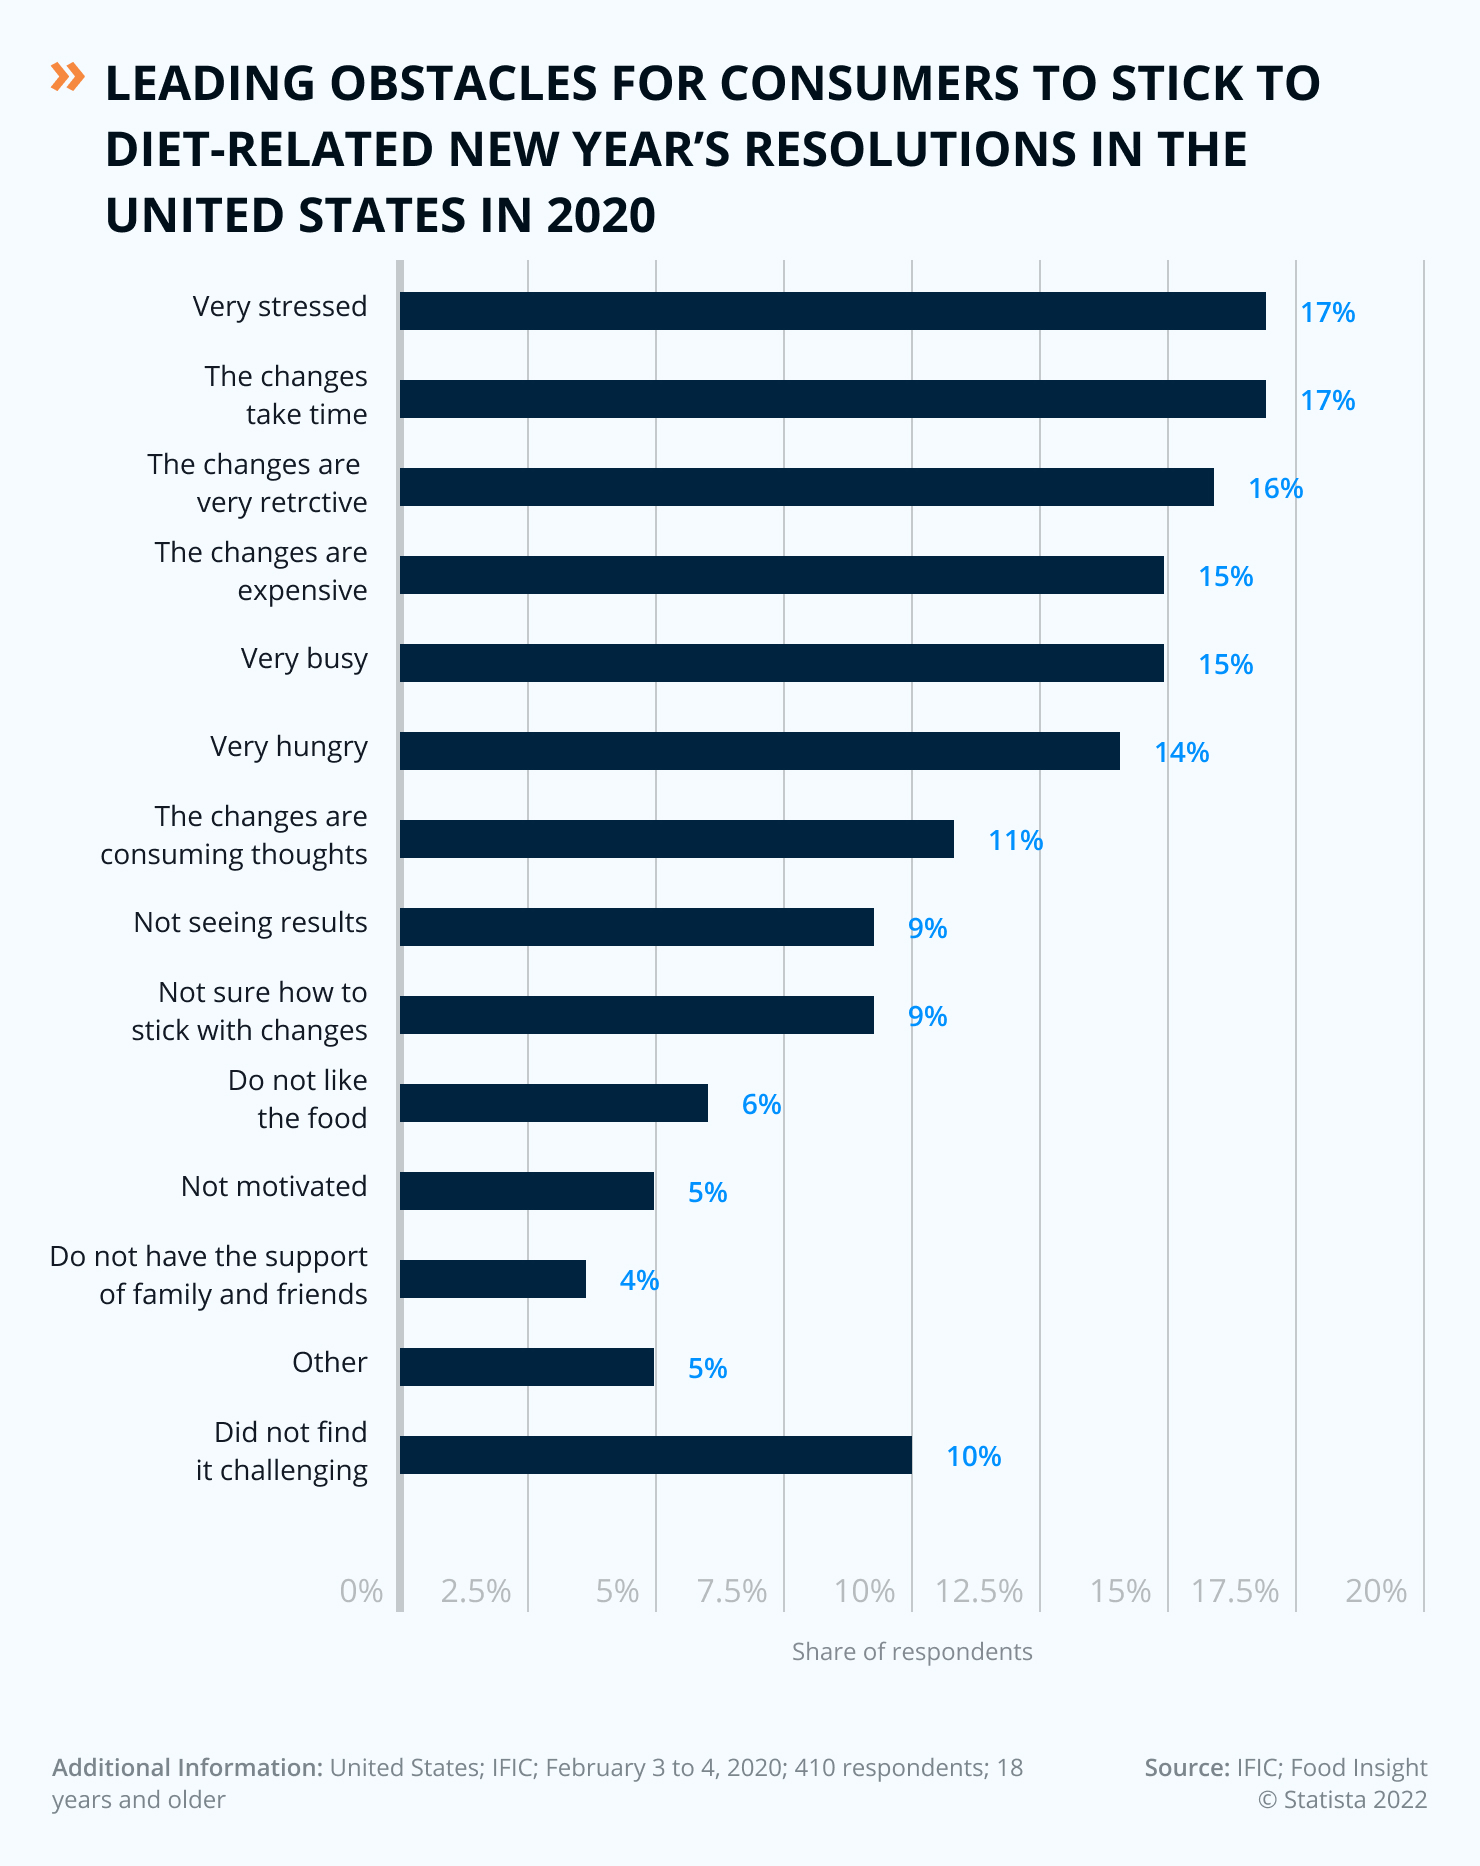
According to the survey[24], the top two reasons are:
- Being very stressed at 17%.
- Changes take time at 17%.
Stress[25] can be a factor in achieving and maintaining weight loss; it can influence weight loss from increased hormones due to stress. The length of time it takes to lose weight is also an obstacle to sticking to a diet, especially if the desired weight loss amount isn’t as fast as the person wants it to be.
Conclusion
Obesity statistics can help with chronic disease prevention; they tell us that the obesity epidemic is getting worse. it is spreading throughout the world, not just creating a burden in the U.S. but ultimately creating a global burden.
Also, obesity statistics can help determine where in the U.S. people with obesity are located. This data can help national institutes, the Centers For Disease Control And Prevention, and other entities determine where help is needed to reduce health disparities.
Knowing what adult populations think is healthy can help better steer the education to what are healthy foods and promote physical activity. It can help these adults contribute positive habits in the same household they live in, breaking the cycle of obesity among children and adolescents.
Author Information
Yelena Wheeler
Health Writer & Registered Dietitian Nutritionist
Media Contact
Erik Pham
Founder of Health Canal
[email protected]